Technical analysts see further downside to Tata Motors as the stock continues correction from recent highs
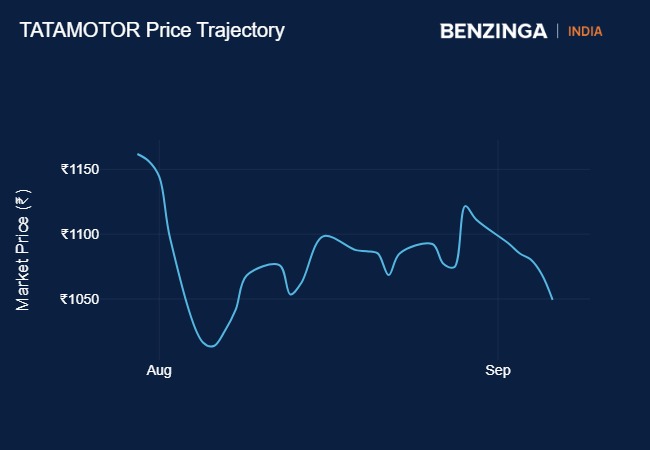
What Happened: Tata Motors has fallen almost 11% from its all-time high of ₹1,179 on July 30. In the last 5 trading sessions, it had declined around 6%. Technical analysts says the stock is showing bearish signals on the chart and could be under further pressure.

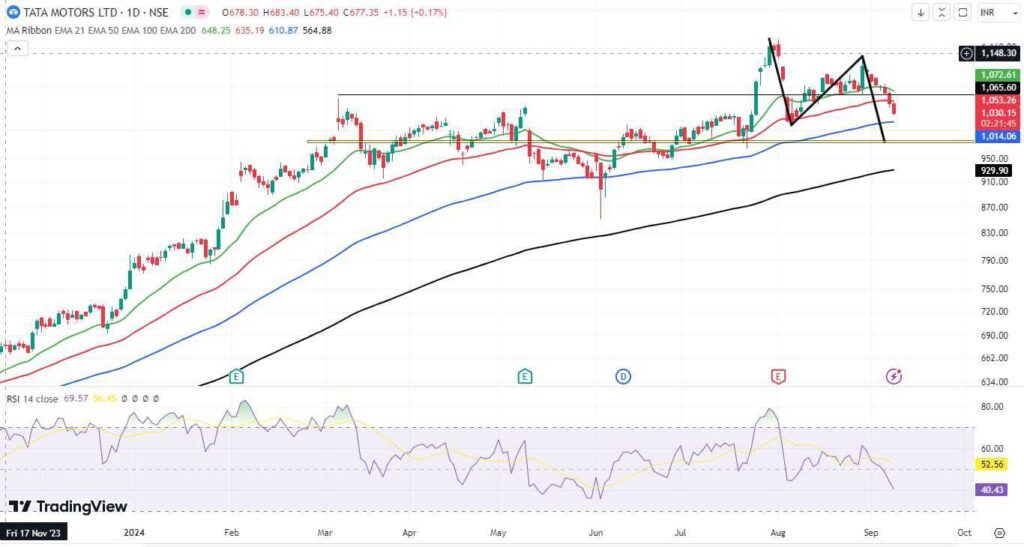
Technical Views: Anshul Jain, head of research at Lakshmishree said that “Tata Motors recently experienced a significant technical movement that has shifted market sentiment. The stock broke out of a rectangular pattern at 1065 and initially surged to 1179. However, this upward momentum was short-lived as the breakout failed, leading to a lower high at 1142. Eventually, the stock closed below the crucial 1065 mark, confirming the failure and a bearish lower high formation.”
Jain added that stock has a long liquidation phase with support levels around 990 and if support falls below that, stock might fall to 921.
See Also: Tata Motors Introduces Discounts Worth Up To ₹2.5 Lakh On ICE Vehicles
Jigar S Patel, senior manager – technical research analyst, Anand Rathi Shares and Stock Brokers said that stock had a possible exhaustion in its upward momentum after reaching its peak. Tata Motors stock breached its 20-day and 50-day Exponential Moving Averages. “A violation of these levels typically suggests that the stock’s upward momentum has weakened, further confirming a bearish outlook.”, he added.

“As we look ahead, the next expected support zone is between 980-985, which marks a previous demand area where buying interest helped lift the stock in the past. This zone also aligns with the 1:1 price movement (as indicated on the chart), a technical pattern that measures equal legs in the price decline, reinforcing its importance as a potential support. On the indicator front, the daily Relative Strength Index (RSI) has dropped below the 50 level, signalling weakness in the stock’s price action. An RSI reading below 50 typically indicates that selling pressure is dominating, suggesting that Tata Motors could see further downside in the upcoming sessions unless a reversal or strong buying interest emerges.” Patel said.
Rupak De, senior technical analyst, LKP Securities said, “The stock has fallen below the critical near-term 21-day EMA on the daily timeframe. Additionally, the RSI has formed a bearish crossover and is declining, indicating weakening momentum and a negative trend. However, the stock has reached a falling trendline, which could prompt a short-term pullback. Therefore, while the stock appears weak in the short term, it may experience a reactive bounce toward 1080 in the coming days, unless it breaks below 1008.”
Price Action: Shares of Tata Motors were trading down 1.70% at ₹1,031.55 on Monday afternoon.
Read Next: HAL Inks ₹26,000 Cr Contract With Defence Ministry For 240 Aero Engines
Don't miss a beat on the share market. Get real-time updates on top stock movers and trading ideas on Benzinga India Telegram channel.
© 2024 Benzinga.com. Benzinga does not provide investment advice. All rights reserved.