
The India VIX, the volatility index has surged over 11% to breach the 20 mark. The surge in the volatility index is similar to the previous election cycle and markets may continue their downward slide from all-time highs, says analysts.
What Happened: The India VIX was trading at 20.56, up by 11.32% in the late morning session on Monday. This is the highest level since September 2022, when VIX hit the 22 level.
India VIX is a volatility index calculated based on the option prices of the Nifty index. VIX indicates the investor's expectation of market volatility over the next 30 days. The higher the VIX, the higher the expected volatility.
According to the past data, there is a negative correlation between the Nifty and the VIX. When the VIX goes up, Nifty falls and vice versa.
In today's trading session, Nifty 50 was down 0.39% and was trading at 21,969.30 levels.
Also read: Mahindra Sold 6,160 Thars In April, Up 16%, Scorpio Sales At 14,807 Units
What Are Analysts Saying: Anand James, Chief Market Strategist of Geojit Financial Services said, “VIX's behaviour now has a lot of similarity to the period shortly before the 2019 electoral results announcement. Then too, markets had come off peaks in March, and VIX shot up to 28.6. The main difference is that prior to this, VIX was in a 20-14 range during the previous 6 months, pointing to volatility expectations being reasonably high for an extended period. In stark contrast, VIX's rise from record lows to above 20 now, has unfolded in just a fortnight's time. So, while recent history points to more room for upside in VIX and thereby volatility, the abruptness in the rate of change of VIX, may lead to a cool off, perhaps even before the electoral results.”
Jigar S Patel, Senior Manager – Technical Research Analyst, Anand Rathi Shares and Stock Brokers said, "At present, India Vix has gained almost 100 % after making the low of 9.85 last month. In below chart Vix is at 20.6 levels which is near R4 camarilla yearly pivot resistance. Note that R3 & R4 both act as reversal zone. In worst case, if Vix closes above 21 then we might test 34 levels also. On the indicator front: Monthly Stochastics India vix has made hidden bear divergence as depicted in the chart. Based on this analysis, one can expect India vis to cool down from 20-21 zone for at least short-term.
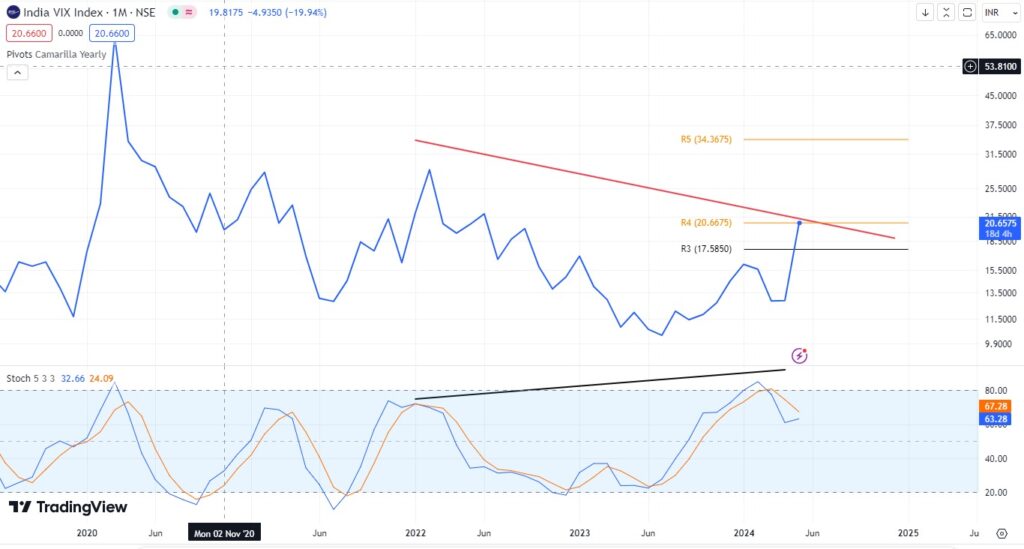
Note: "Hidden Bear divergence" occurs when price makes a lower high (LH), but the oscillator(in our case stochastic) is making a higher high (HH)," he added.
© 2025 Benzinga.com. Benzinga does not provide investment advice. All rights reserved.