
Advanced Micro Devices Inc AMD will be reporting its third-quarter earnings on Wednesday. Wall Street expects 92 cents in EPS and $6.71 billion in revenues as the company reports after market hours.
The stock is up 65.19% over the past year, 14.65% YTD.
Let’s look at what the charts indicate for AMD stock and how the stock currently maps against Wall Street estimates.
Read Also: AMD Q3 Earnings Preview: Can AI, Server Gains Help Narrow The Semiconductor Gap With Nvidia?
AMD Stock Chart Mixed Ahead Of Q3 Earnings
AMD stock is currently trading at $159.23, reflecting a mixed technical picture with some bullish signals but also potential bearish indicators.
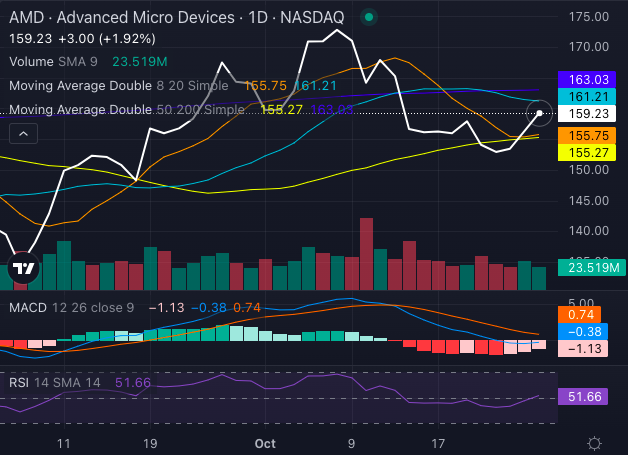
Chart created using Benzinga Pro
The stock’s price is above its five, 20 and 50-day exponential moving averages, showing a bullish trend, although slight selling pressure is evident. The price is also above its eight-day ($155.75) and 50-day ($155.27) simple moving averages, signaling bullish momentum in the short term.
However, AMD’s price falls below the 20-day ($161.21) and 200-day ($163.03) SMAs, indicating potential resistance at these longer-term levels.
With a MACD reading of a negative 0.38 and an RSI of 51.66, the stock is heading towards being oversold, which could suggest a chance of future recovery if buying interest strengthens.
AMD Analysts See 33% Upside
Ratings & Consensus Estimates: The consensus analyst rating on AMD stock stands at a Buy currently with a price target of $194.90. The three most recent analyst ratings for AMD stock were issued by Rosenblatt, Roth MKM and Cantor Fitzgerald in October. With an average price target of $210, these ratings suggest a potential 31.98% upside for AMD stock.
AMD Price Action: AMD stock was up 2.3% to $159.92 on Monday.
Read Next:
Photo: Shutterstock
© 2025 Benzinga.com. Benzinga does not provide investment advice. All rights reserved.