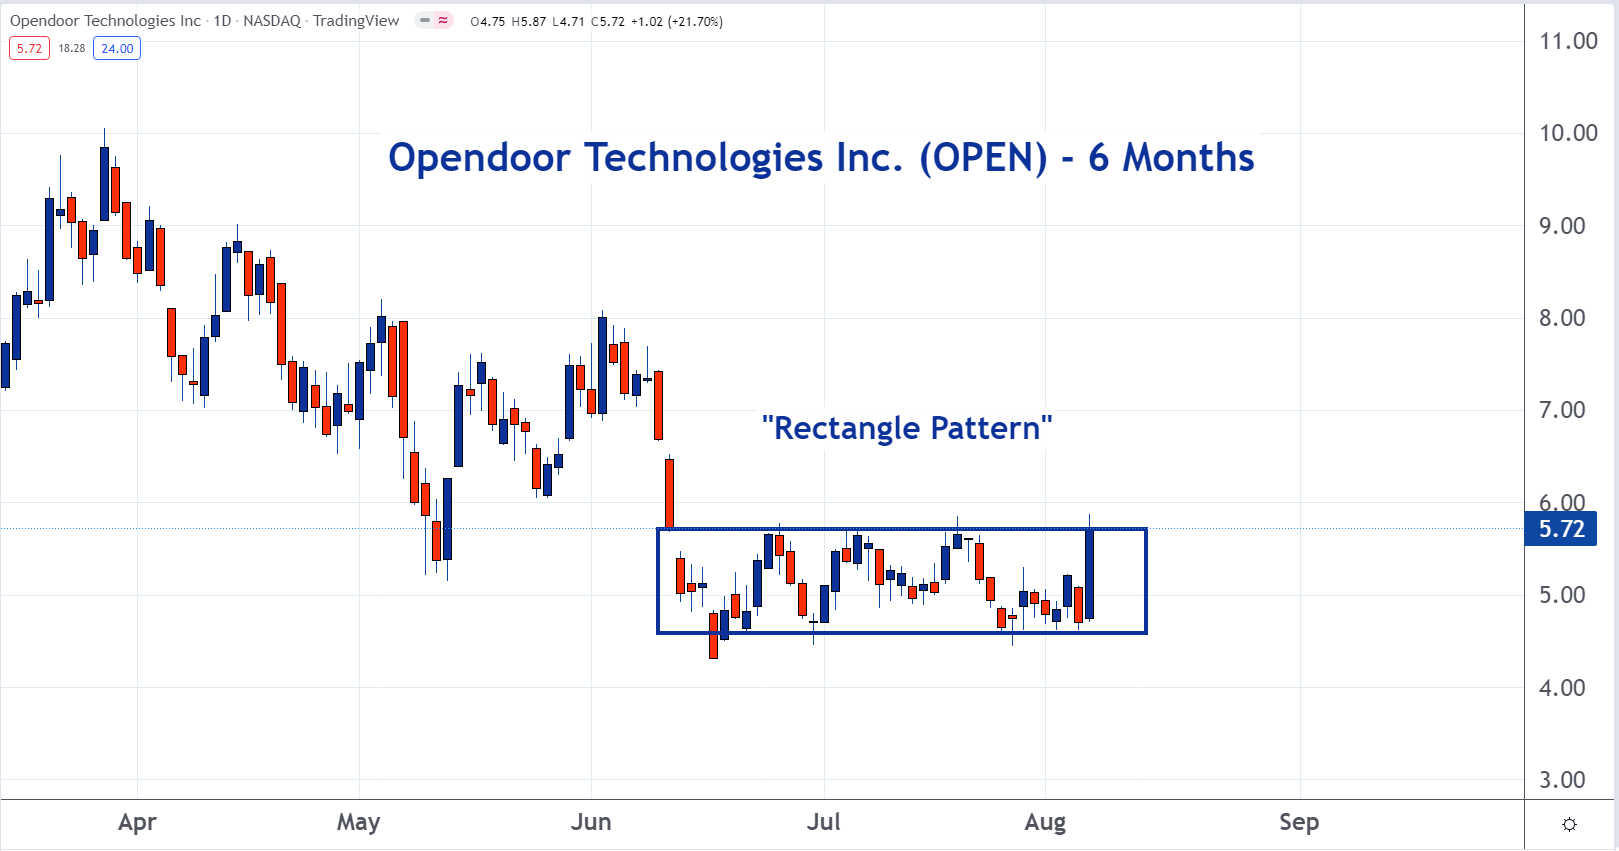
When a stock is in a trading range for an extended period of time, a rectangle pattern forms on the charts. This is the case with Opendoor Technologies OPEN.
There is resistance, or a large group of investors who are trying to sell, at the top of the range. There is also support, or a large group of investors who are trying to buy, at the bottom of the range.
In general, there are two ways to profit from a trading range. One is to buy close to the bottom and sell near the top. The other is to wait for a breakout, or breakdown to occur, and get in if and when a new uptrend or downtrend forms.
To learn more about trading, check out the new Benzinga Trading School.
© 2025 Benzinga.com. Benzinga does not provide investment advice. All rights reserved.