
As AbbVie Inc. ABBV and Novartis AG NVS prepare to report their fourth-quarter earnings before market open on Friday, investors are eyeing the technical setups of both pharmaceutical giants.
While AbbVie is stuck in a stagnating trend, Novartis appears to have a stronger bullish momentum.
Let's break down the charts.
AbbVie: Caught In Neutral Gear
AbbVie's technical setup presents mixed signals.
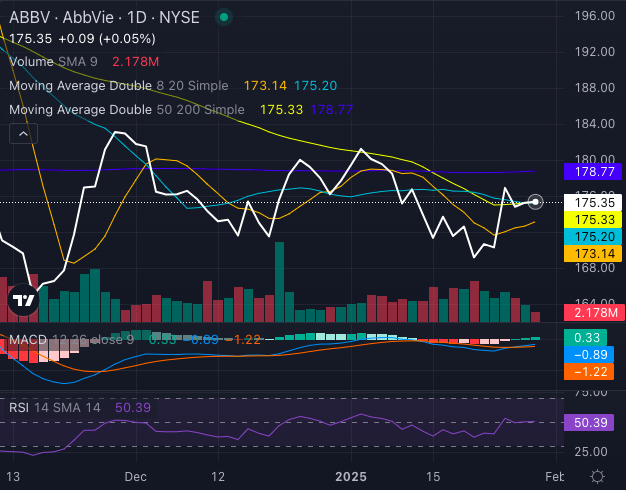
Chart created using Benzinga Pro
AbbVie stock is trading above its short-term moving averages, with the eight-day ($173.14) and 20-day ($175.20) SMAs (simple moving averages) flashing bullish indicators. However, longer-term trends tell a different story — AbbVie stock is aligned closely against its 50-day ($175.33) SMA and below its 200-day ($178.77) SMA, suggesting lingering downside pressure. The MACD (moving average convergence/divergence) indicator at a negative 0.89 reinforces this bearish bias, while the RSI (relative strength index) at 50.39 indicates neutral momentum.
Overall, AbbVie is struggling for direction, with slight selling pressure keeping a lid on any breakout potential. A strong earnings beat could push the stock past key resistance levels, but the current setup suggests AbbVie is vulnerable to further consolidation.
Novartis: Riding A Bullish Wave
Novartis, on the other hand, is trending decisively higher.
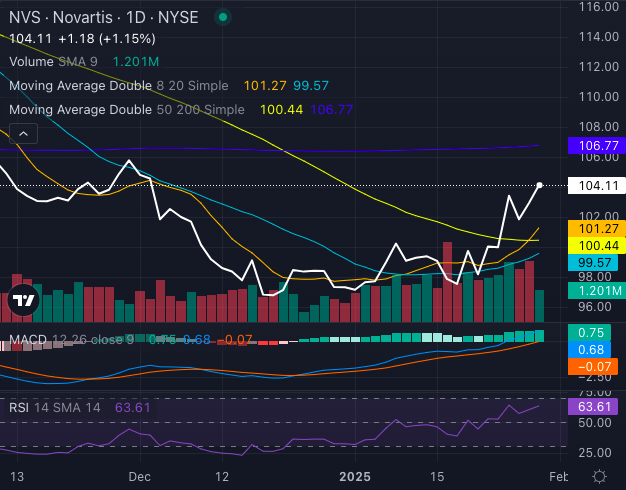
Novartis is trading above its short-term and mid-range moving averages, with the eight-day ($101.27), 20-day ($99.57), and 50-day ($100.44) SMAs all acting as support. The MACD at 0.68 points to bullish momentum, while the RSI at 63.61 shows strength without being overbought.
However, the stock remains below its 200-day SMA ($106.77), leaving some room for caution.
Investor Implications
Heading into earnings, Novartis holds the technical advantage, displaying a stronger bullish structure and upward momentum. AbbVie, meanwhile, remains stuck in a range, needing a catalyst to break higher.
Investors should watch key resistance levels — AbbVie above $177 and Novartis above $106 — for signs of further movement post-earnings.
Read Next:
Photo: Romix Image via Shutterstock
Don't miss a beat on the share market. Get real-time updates on top stock movers and trading ideas on Benzinga India Telegram channel.
© 2025 Benzinga.com. Benzinga does not provide investment advice. All rights reserved.