Suzlon‘s share price has been under pressure ever since the company posted its results for the quarter ended March.
What Happened: The wind energy major posted around 10% loss during the January-March period at ₹254 crore. Since the results, the stock has gone down around 7%. Over the past year, the stock has been on a bull run as investors seem to be getting behind the company’s turnaround story.
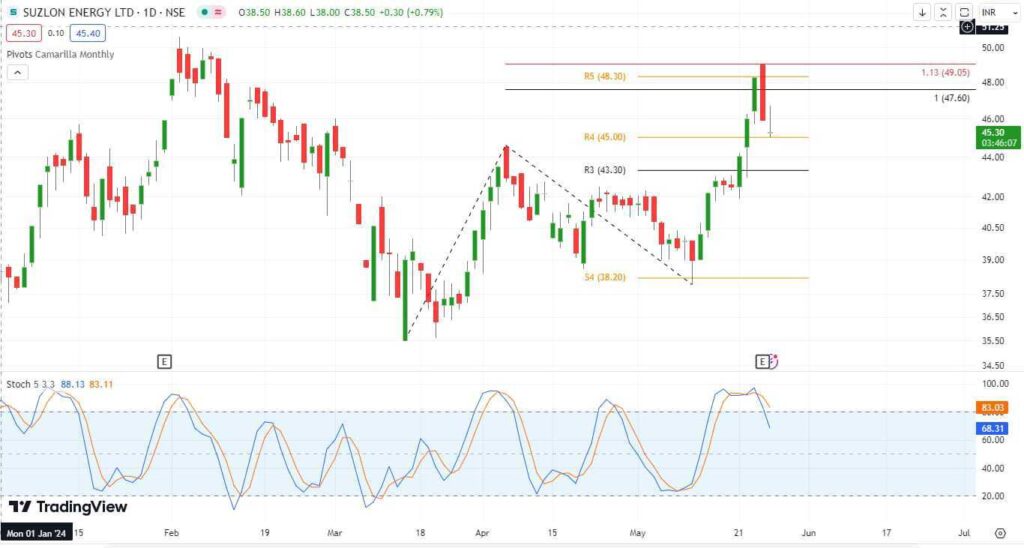
What Are The Charts Saying? “Over the past few weeks, Suzlon’s stock has surged by 11 points, resulting in a notable gain of 29%. However, recent developments on the daily chart indicate potential concerns for investors. Suzlon has formed a significant bearish engulfing candlestick pattern near its previous historical peak,” said Jigar S Patel, senior manager – technical research analyst, Anand Rathi Shares and Stock Brokers told Benzinga India.
He added that this bearish signal, which occurs when a larger bearish candle completely engulfs the previous smaller bullish candle, suggests a potential reversal in the trend.
“Additionally, this pattern has emerged precisely around the R5 Camarilla monthly resistance pivot, a technical level that often acts as a significant barrier,” he added. Considering these factors he advises caution to investors and advises to consider booking profits within the price range of 45-47 and refrain from initiating new long positions at this time.
Kush Ghodasara, Independent Market analyst said, “The stock has been taking support at the trend line since the low in May 2023 which is currently at 40.” He added that some weakness has been created in momentum due to an intraday profit booking but MACD is still showing strength in the price action.
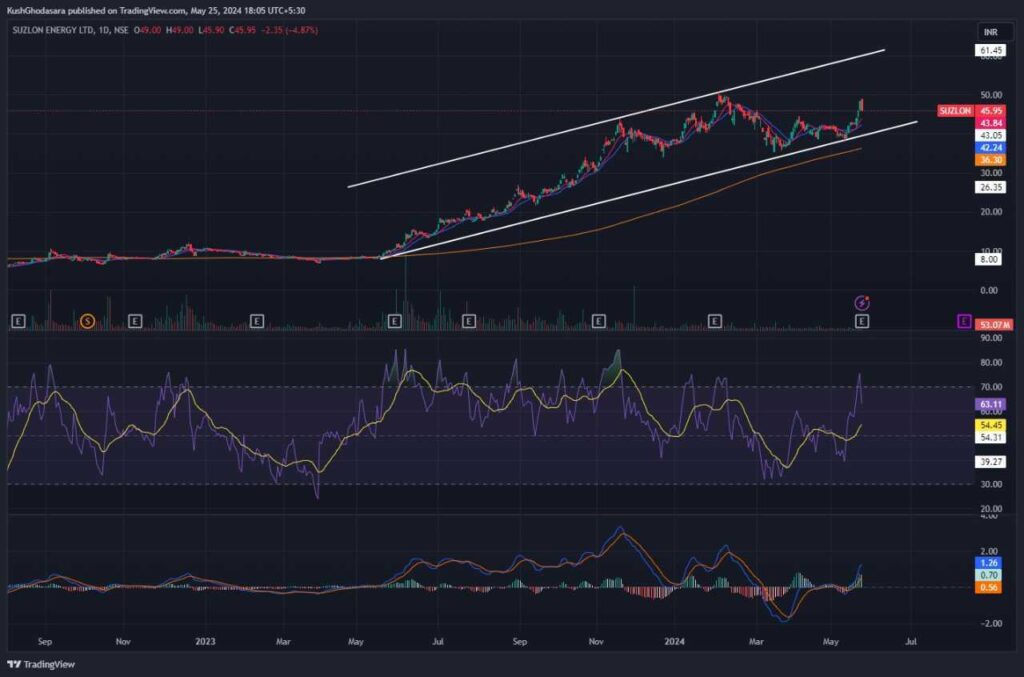
“Short-term moving average which is at 42 can as a support and also stop loss while the target for the short term can be at trend line level 62,” Ghodasara said.
Anshul Jain, head of research at Lakshmishree, said that currently, the stock is exhibiting a noteworthy technical formation on its daily charts, characterized by the development of a bullish cup and handle pattern spanning a duration of 66 days. “This pattern is poised for a breakout upon reaching the critical level of ₹48. Upon surpassing this pivotal point, the trajectory indicates a potential ascent towards the ₹60 range,” Jain added.
“In summary, Suzlon presents an intriguing opportunity for investors, with its technical setup suggesting potential for further upside movement. However, prudent consideration of market dynamics and risk management strategies is advised,” he further explained.
Price Action: Suzlon’s share price was down 1.20% to trade at ₹45.40 on Monday afternoon.
Read Next: RVNL Shares Surge 7% To Hit All-Time High After Order Win
© 2025 Benzinga.com. Benzinga does not provide investment advice. All rights reserved.