
Tata Motors’ share price has been under pressure ever since the company posted its results for the quarter ended March.
What Happened: The stock crashed around 9% after the announcement came out. The auto giant has been racing at the bourses for quite some time. In the past six months, the stock has gone up 40%. Today, the stock slumped around 1.5% to hit an intraday low of ₹950.50.
What Are The Charts Saying? Rupak De, senior technical analyst at LKP Securities said that in the short to medium term Tata Motors has a bearish outlook. “The stock has fallen below the short-term moving average of 55 Exponential Moving Average (EMA) in the last 3 days. The immediate support for the stock would be around the 890 level. The next support would be at 825. The resistance is at 980. Above the 980 level, the stock might witness a bullish reversal. The trend will remain negative till the time it is trading below 980," he added.
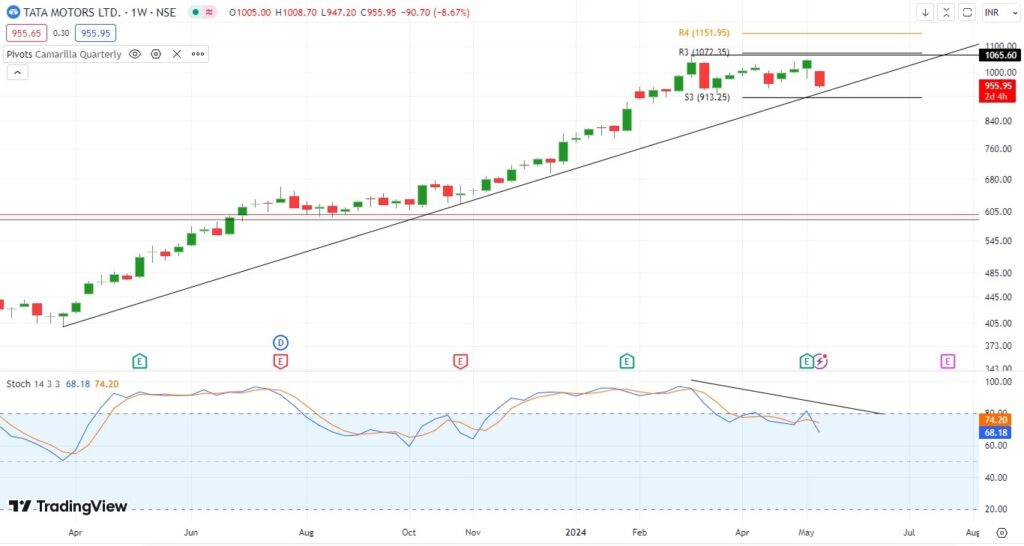
Jigar S Patel, senior manager – technical research analyst, Anand Rathi Shares and Stock Brokers thinks that from a technical analysis perspective, concerning signals have emerged. “Currently, the stock is encountering significant resistance near the R3 Camarilla quarterly pivot point, indicating a challenging barrier to further upward movement,” he said.
See Also: Go Digit IPO Latest Subscription Status, GMP, And Key Details
He adds that going forward it’s anticipated that support levels will likely be found around the range of 910 to 915, providing a potential cushion for downward movements. Conversely, resistance is expected near the 1000 mark, suggesting a hurdle for upward price action.
However, he cautions that If Tata Motors’ stock closes below the 900 mark, it could trigger panic selling among investors. “Consequently, it’s advisable for traders to consider booking profits and refrain from taking long positions in the stock until there’s greater clarity regarding its direction and stability,” he added.
Anshul Jain, head of research at Lakshmi Shree Investment said that the stock has been trading within a tight range of 1065-921 over the past several months. He added that the technical pattern suggests an imminent breakout, likely on the upside.
“If the stock breaks above 1065, it could trigger a substantial move, potentially gaining 200 points. This expected upward breakout suggests strong buying interest and positive market sentiment. Investors are advised to monitor the stock closely, as a decisive close above the resistance level could lead to significant gains,” he added. He also advised caution and setting appropriate stop-loss levels to manage risk in this volatile phase.
Riyank Arora at Mehta Equities noted that Tata Motors has recently broken down from an ascending triangle pattern and closed below its 50-day Exponential Moving Average (EMA), indicating potential bearish momentum. “The Relative Strength Index (RSI) is currently below 60, suggesting weakened momentum. A drop below ₹945 could lead to further declines towards the ₹920 and ₹900 levels. However, a reversal above ₹980 could invalidate this bearish outlook and suggest a potential recovery. Overall, the technical indicators point to a bearish sentiment for Tata Motors at its current levels,” he added.
Price Action: Tata Motors’ share price was down 1.38% to trade at ₹951.30 in the late hours of trading on Wednesday.
Read Next: LIC Shares Up 4% After SEBI Grants Extension To Achieve Minimum Public Shareholding
Don't miss a beat on the share market. Get real-time updates on top stock movers and trading ideas on Benzinga India Telegram channel.
© 2025 Benzinga.com. Benzinga does not provide investment advice. All rights reserved.